We’ve been providing quarterly statistics from our online donation pages, fundraising pages and event registration sites this year. Below are statistics from our third quarter of 2018.
Check out the first quarter and second quarter statistics.
Help us reach our goal
We are making progress toward our goal for 2018 to raise $15 million for charity through our platform. As of November 1, we have raised $11.8 million. We can meet our goal, but we need your help. Follow me on Twitter to see our weekday posts of nonprofits that you can give to. Search for the hashtag #4aGC.
Online giving trends
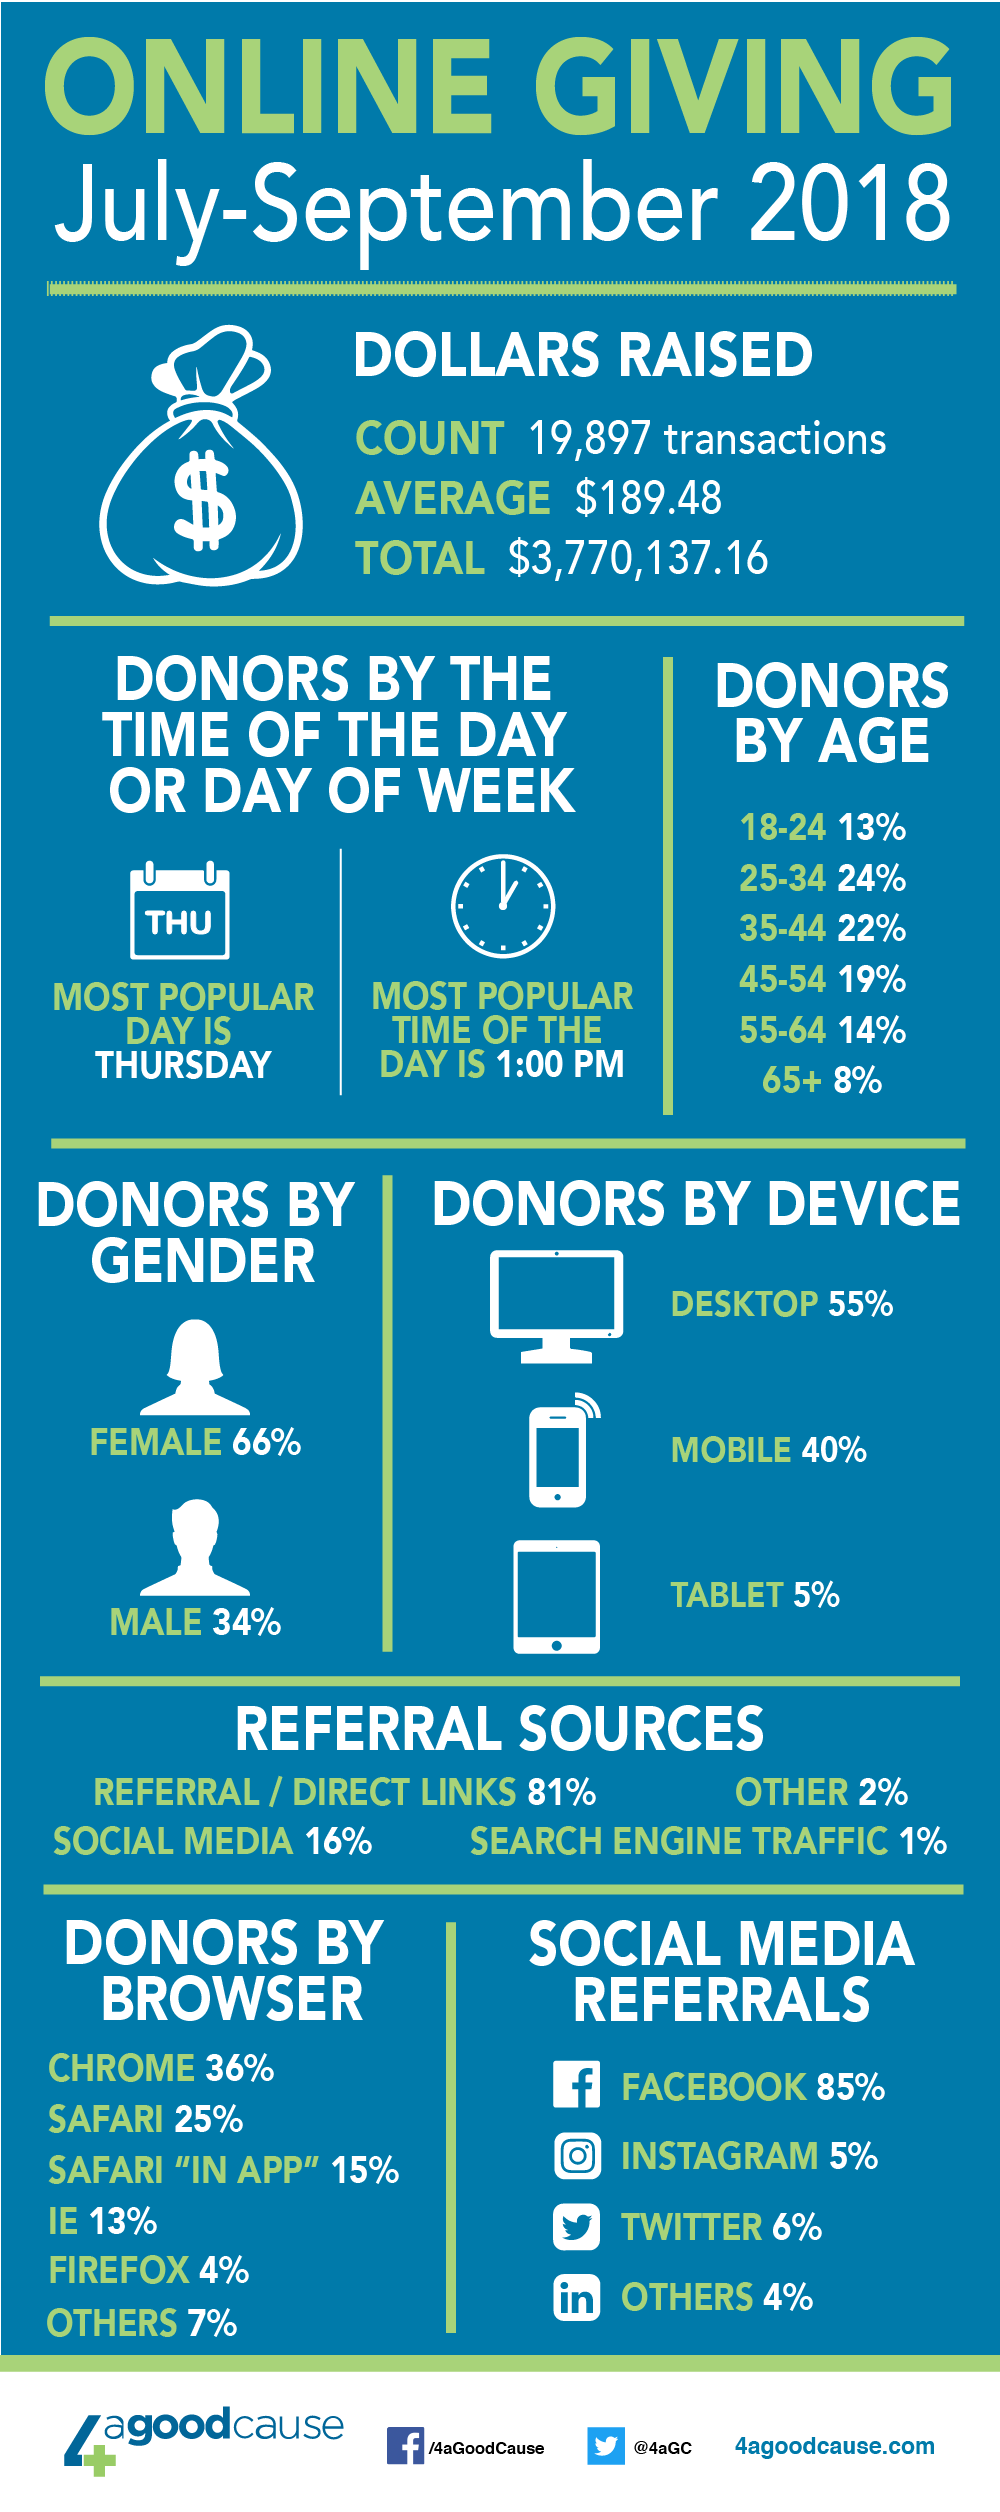
Below you’ll find an infographic breaking down the numbers from July 1, 2018, through September 30, 2018. A few key takeaways include the following:
- Traffic from mobile devices continues to grow, reaching the 40% milestone this quarter. Make sure to include mobile devices in your donation and fundraising page testing.
- While online giving spans all generations fairly evenly, Millenials lead the way in online giving with 24% of our traffic. Are your appeals reaching this important demographic?
- The average transaction size this quarter was $189.48, up for the third consecutive quarter. We are currently in the fourth quarter of the year when most donations are processed. Make sure you are doing all you can to increase your average donation size.

Copy this code to embed this infographic on your site
Keep reading
Once a week or so we send an email with our latest article on online fundraising, nonprofit marketing and more. We never bug you; we just send you our latest piece of content. Subscribe now >


