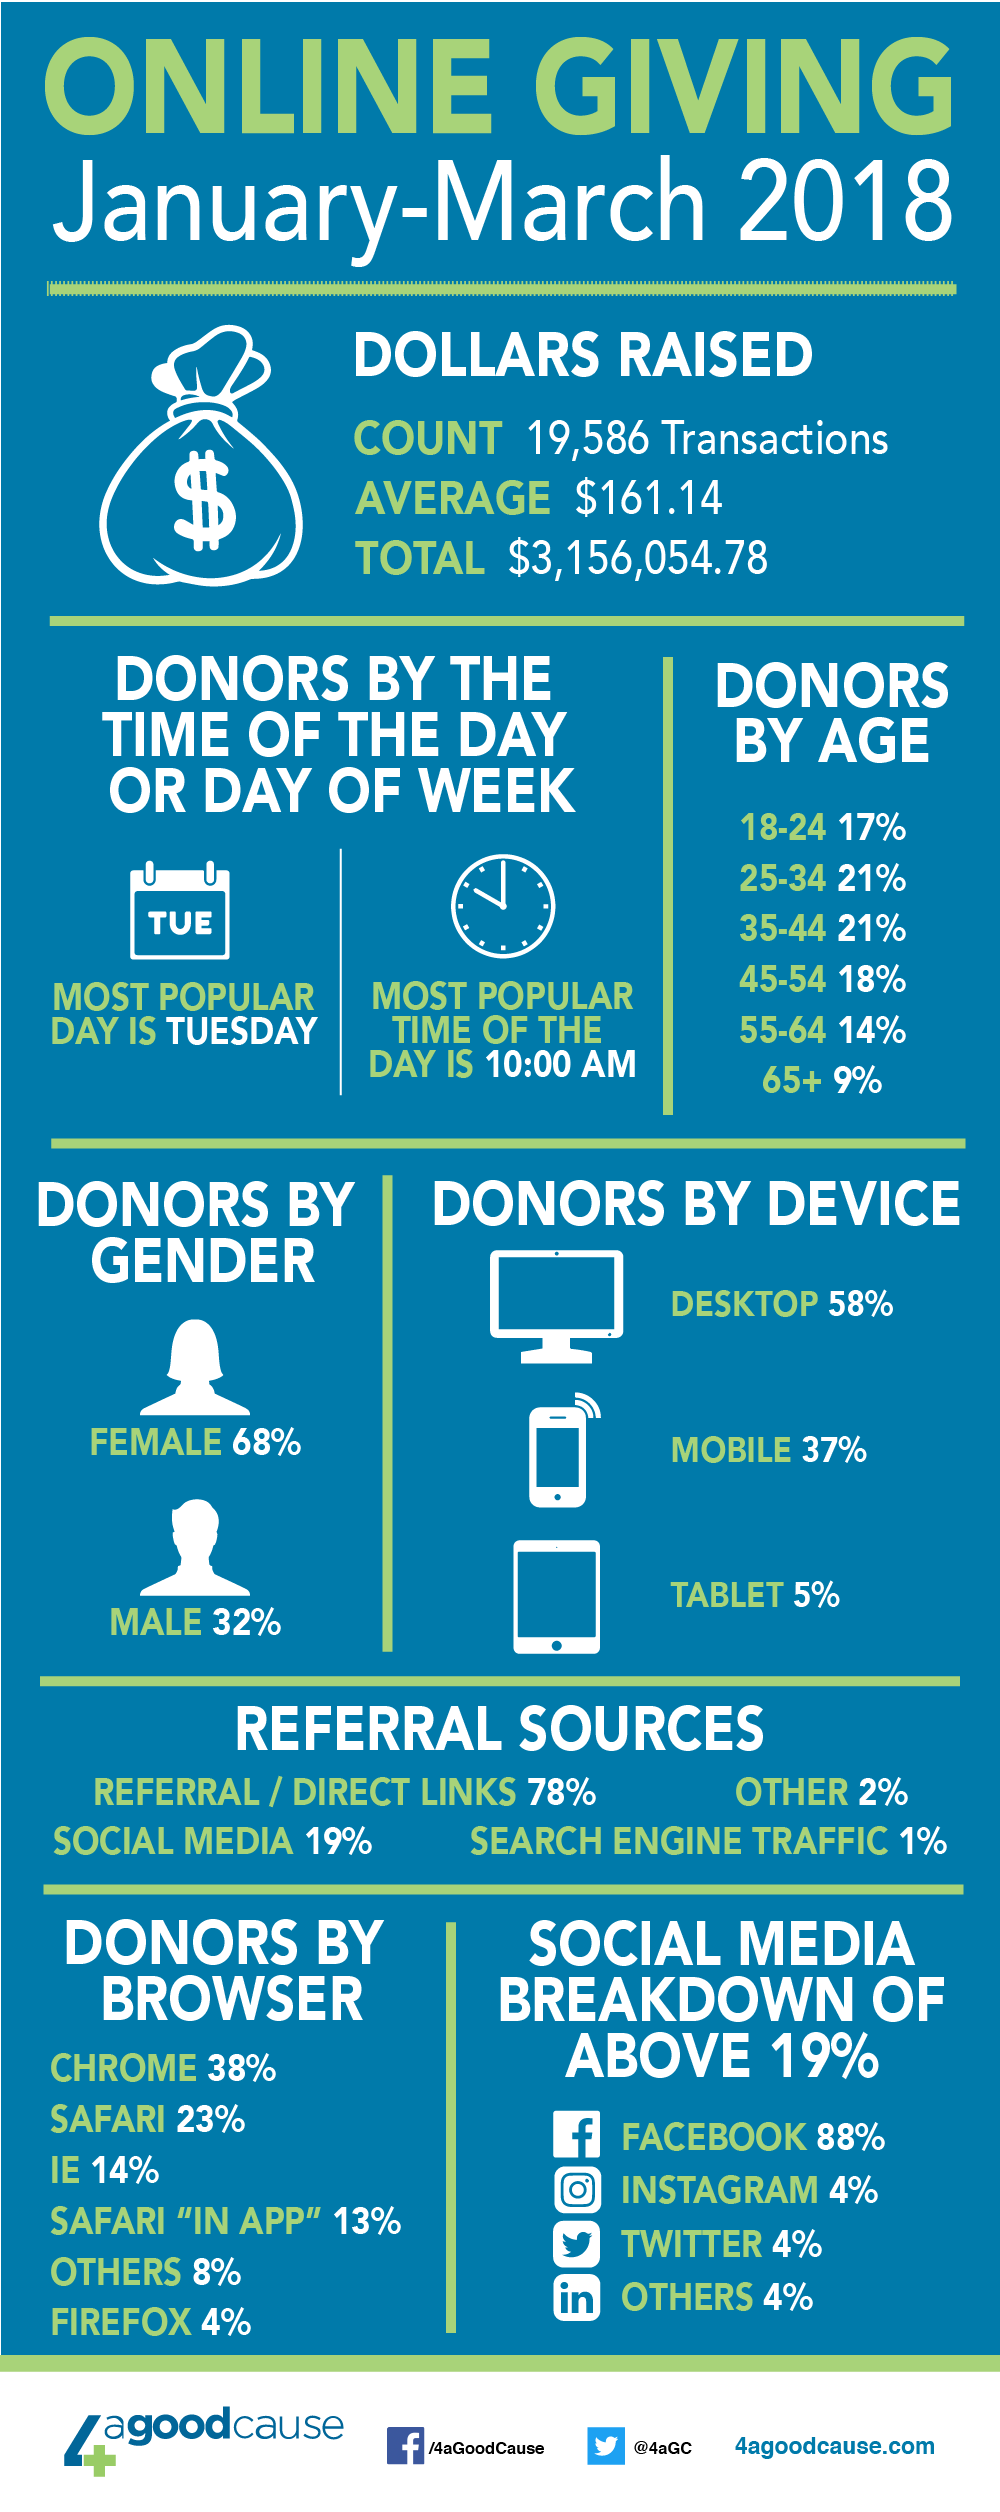
In an effort of transparency, we’ve chosen to provide quarterly statistics from our online fundraising pages detailing who is giving as well as how and when they are doing so. We hope that this will also give you an inside look into giving trends and that you will be able to focus your marketing and fundraising efforts to reach donors accordingly.
Below you’ll find an infographic detailing the numbers from January 1, 2018 through March 31, 2018. In 2018, our goal is to raise $15 million for charity through our platform. Follow me on Twitter to see our daily posts of nonprofits you can give to. Look for the hashtag #4aGC. We’re glad to have your partnership as we aim to meet this goal.

Copy this code to embed this infographic on your site
Keep reading
Once a week or so we send an email with our latest article on online fundraising, nonprofit marketing and more. We never bug you; we just send you our latest piece of content. Subscribe now >


